说明
适合画连线的图,并能做一些复杂操作
例如:
markupConfig,就是配置里的markupConfig
attrsConfig,就是配置里的attrsConfig
依次类推
下载与注意事项
npm install @antv/x6 --save
https://x6.antv.antgroup.com/zh/examples/layout/tree/#mindmap
初始化
javascript
import { Graph } from '@antv/x6'
const container = document.getElementById('container');
const clientRect = container.getBoundingClientRect();
const width = clientRect.width || 1200;
const height = clientRect.height || 500;
const graph = new Graph({
    width,height,container,
    ...config
})
配置
基本上,不需要args参数时,都可以简写
config
base
| 选项 | 类型 | 描述 | 示例 |
|---|---|---|---|
| width/height | string | 宽/高 | |
| container | DOM/string | 挂载的元素或它的id | |
| virtual | boolean | 是否只渲染可视区域内容 | |
| async | boolean | 是否启用异步渲染 | |
| autoresize | boolean | 是否监听容器大小 | |
| grid | boolean | Object | |
| background | Object | 配置背景 | |
| panning | boolean | Object | |
| mousewheel | boolean | Object | |
| scaling | Object | 画布的最大最小缩放级别 | |
| connecting | Object | 交互 | connecting:connectingCfg |
| highlighting | Object | 高亮器,支持以下配置项 1. default 默认高亮选项2. embedding 拖动节点进行嵌入操作过程中,节点可以被嵌入时被使用。3. nodeAvailable 连线过程中,节点可以被链接时被使用。4. magnetAvailable 连线过程中,连接桩可以被链接时被使用。5. magnetAdsorbed 连线过程中,自动吸附到连接桩时被使用。 | highlighting: { magnetAvailable: { name: 'stroke', // 边框高亮器 name: 'classname' // 样式名高亮器 } } |
connectingCfg
| 配置项 | 类型 | 描述 | 示例 |
|---|---|---|---|
| snap | boolean | string | |
| allowBlank / Loop / Node / Port / Multi | boolean | (Graph, args)=>boolean | |
| highlight | boolean | 拖动边时,是否高亮所有可用连接桩或节点 | |
| router | string/object | 边的路径点 vertices 做进一步转换处理, 并在必要时添加额外的路径点 | router:{ args:{}, name:'normal', //默认路由 //{name:'er', //实体关系路由,Z字形 //name:'orth', //正交路由 //name:'oneSide'', //受限正交路由 //name:'manhattan'', //智能正交路由 //name:'metro'', //智能地铁线路由 } |
| createEdge | (Graph,args)=>Nilable<Edge> | 通过该方法自定义新建边的样式 | |
| connector | string/object | 连接器 | |
| validateEdge | (Graph,args)=>boolean | 当停止拖动边时校验这个边是否有效, false则会删除这条边 | |
| validateMagnet | (Graph,args)=>boolean | 校验哪些元素可作为磁力点(magnet), | |
| validateConnection | (Graph,args)=>boolean | 校验哪些元素可被连接 | |
| anchor | Object/String | 节点锚点 | |
| edgeAnchor | Object/String | 边锚点 | |
| source/targetEdgeAnchor | EdgeAnchorOptions | 当连接到边时,起点/终点 边的锚点 | |
| targetAnchor | NodeAnchorOptions | 当连接到节点时, | |
| 组合 |
elementCfg
元素配置项
基本上,不需要args参数时,都可以简写
| 选项 | 类型 | 描述 | 示例 |
|---|---|---|---|
| id | string | 节点/边的唯一标识, 推荐使用具备业务意义的 ID, 默认使用自动生成的 UUID。 | |
| zIndex | Number | 层级,一般用来设置边, 防止边遮挡节点 | |
| markup | Markup | 节点/边的 SVG/HTML 片段。 | markup:markupConfig |
| attrs | Attr.CellAttrs | 节点/边属性样式。 | attrs:attrsConfig |
| shape | string | 元素类型 节点默认值为rect, 边对应的默认值为edge | |
| tools | ToolItem | ToolItem[] | Tools |
| data | any | 节点/边关联的业务数据。 用来存储与配置无关的数据, 通过cell.getData()获取节点/边关联的业务数据。 | |
| x/y | number | 节点的定位 | x:120,y:10 |
| label | string | 节点的文本 | |
| component | 使用组件 | component:MyComponent | |
| angle | number | 节点的旋转角度。 | |
| ports | object | 连接桩。 | 见节点/连接桩 |
| source/target | TerminalData | 起点/终点 连接的节点id以及连接桩/锚点信息。 | target: { cell: 'target-id', anchor: 'orth', // 节点锚点, 边锚点 }, |
| vertices | Point.PointLike[] | 路径点。 边从起点开始, 按顺序经过路径点, 最后到达终点。 | vertices: [ |
| router | RouterData | 路由。 对 vertices 进一步处理, 并在必要时添加额外的路径点 通过name指定路由类型 支持args,无args时可简写 | router:{ args:{}, name: 'normal', // 默认路由 //{name: 'er', // 实体关系路由,Z字形 //name: 'orth', // 正交路由 //name: 'oneSide'', // 受限正交路由 //name: 'manhattan'',// 智能正交路由 //name: 'metro'', // 智能地铁线路由 } |
| connector | ConnectorData | 连接器。如何连接路径点 | connector:{ |
| zIndex | number | 节点/边在画布中的层级,默认根据节点/边添加顺序自动确定。 | |
| visible | boolean | 节点/边是否可见。 | |
| parent | string | 父节点。 | |
| children | string[] | 子节点/边。 |
节点类型
rect

ellipse
text-block
image
markupConfig
自定义这个东西添加的元素
| 配置项 | 描述 | 类型 | 常见配置示例 |
|---|---|---|---|
| tagName | 对应元素类型(与节点类型一致) | tagName:'rect', | |
| selector | 当前元素的唯一选择器, | selector:'body', | |
| groupSelector | 群组选择器, | groupSelector: 'line', | |
| textContent | text类型的元素显示的文字 | ||
| children | 子元素 | children:[与父元素一样的配置] |
attrsConfig
javascript
//attrs通过指定选择器为元素修改样式
const attrsConfig= {
    body: tagCfg,
    label:tagCfg
    //选择器:tagCfg
}
tagCfg
| 名称 | 类型 | 备注 | 示例 |
|---|---|---|---|
| x/y | Number | 向x/y轴平移多少像素 | |
| fill | String | 填充颜色 | |
| stroke | String | 边的颜色 | |
| strokeWidth | Number | 边的粗细 | |
| opacity | Number | 透明度 | |
| fontSize | Number | 字体大小 | |
| fontFamily | String | 字体 | |
| cursor | String | 同css cursor | |
| textAnchor | String | 文本基于其锚点的水平对齐方式, 值:start,middle(默认),end | |
| textVerticalAnchor | String | 文本基于其锚点的垂直对齐方式, 值:top,middle(默认),bottom | |
| ref | String | 指定 参考元素,默认为body | ref: 'body', //指定参考元素 |
| refX/Y | String | 向x/y轴平移的百分比或偏移量 | refX: '-50%', // 向左偏移参考元素宽度一半 |
| refX2/Y2 | String | 通过refX/Y当需要同时指定偏移量和百分比时使用 | refX: '-50%', refX2:20 |
| refDx/Dy | String | 设置元素坐标为相对于 参考元素 右下角的x,y偏移量 | |
| refRx/y | String | 椭圆半径 | refRy: '25%',椭圆 y 轴半径为参考元素高度的 1/4 |
| refCx/y | String | 椭圆圆心 | refCx: '50%', // 椭圆中心 x 坐标为参考元素宽度一半,即位于参考元素的中心 |
| refWidth/Height | String | 宽高为 参考元素 的百分比或加多少像素 | refWidth: '50%', // 宽度为参考元素宽的一半 refWidth: '20', // 宽度为参考元素宽+20px |
| refWidth2/Height2 | String | 同refWidth/Height,需同时指定时使用 | refWidth: '50%', refWidth: '20', // 宽度为参考元素宽的一半+20px |
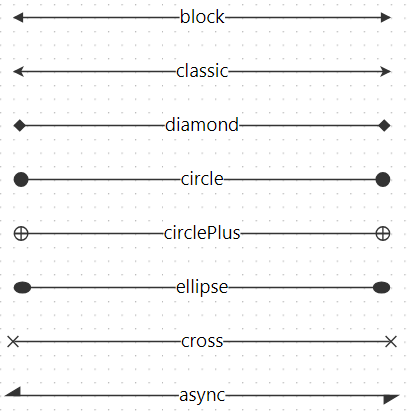
| source/targetMarker | String | Object |
箭头类型
tools
直接写在元素的tools配置项上
或者通过 元素.addTools(config)添加
| 工具类型 | 描述 |
|---|---|
| boundary | 渲染一个包围元素的矩形。注意,该工具仅仅渲染一个矩形,不带任何交互。 |
| button | 在指定位置处渲染一个按钮,支持自定义按钮的点击交互。 |
| button-remove | 在指定的位置处,渲染一个删除按钮,点击时删除对应的元素 |
| node-editor(节点特有) | 提供文本编辑功能。 |
| edge-editor(边特有) | 提供文本编辑功能。 |
| vertices(边特有) | 路径点工具,在路径点位置渲染一个小圆点,拖动小圆点修改路径点位置,双击小圆点删除路径点,在边上单击添加路径点。 |
| segments(边特有) | 线段工具。在边的每条线段的中心渲染一个工具条,可以拖动工具条调整线段两端的路径点的位置。 |
| source/target-arrowhead(边特有) | 在边的起点或终点渲染一个图形(默认是箭头),拖动该图形来修改边的起点或终点。 |
使用
javascript
const tools = [{
  name: 'button', //工具类型
  args: {
    // tools直接在markup中定义元素的样式,格式为[{...,attrs:{样式配置}}]
    markup: [{...markupConfig[0],attrs: arrsConfig.body}],
    x: '100%',y: '100%',
    offset: { x: -20, y: -20 },
    onClick({ cell }: { cell: Cell }) {}, //cell对应点击的节点
  },
}]

// 创建元素时添加小工具
graph.addNode/Edge({
    ...,
    tools
})


//判断是否有某个别名的工具
node/edge.hasTools(别名)
// 创建元素后添加小工具
node/edge.addTools(tools,别名)
//移除所有工具
node/edge.removeTools();
鼠标悬浮添加工具,离开移除
javascript
graph.on('edge:mouseenter', ({ cell }) => {
  cell.addTools(
    [
      'vertices',        //转折点工具
      'segments',        //调整边工具
      'button-remove',   //移除按钮
      {
        name: 'target-arrowhead',
        args: {
          attrs: {
            fill: 'red'
          }
        }
      }
    ],
    'onhover'
  );
});

graph.on('edge:mouseleave', ({ cell }) => {
  if (cell.hasTools('onhover')) {
    cell.removeTools();
  }
});
自定义
javascript
//在原有工具基础上,进行修改
const MyButton = Button.define<Button.Options>()
Graph.registerNodeTool('my-btn', MyButton, true)

//自己实现一个,特别难,搞不了
Graph.registerNodeTool('button', Button)
方法
原生方法
| 方法名 | 说明 |
|---|---|
| graph.getNodes/Edges/Ports() | 获取所有节点/边/连接桩 |
| graph.addNode/Edge/Port(config) | 添加节点/边/连接桩 |
| graph.use(plugin) | 使用插件 |
| graph.resize(width,height) | resize画布大小 |
| graph.centerContent() | 将画布中元素居中展示 |
| graph.zoomToFit({ maxScale: 1 }) | 将画布中的元素自适应到刚好放下 |
| graph.getNeighbors(cell, { incoming: true, outgoing: false}) | 获取节点相邻的节点,incoming是输入节点,outgoing是输出节点 |
| graph.getPredecessors/Successors(cell) | 获取节点的所有前序/后续节点, |
| graph.isNeighbor/Predecessor/Successor(cell,cell2) | 判断cell2是不是cell的相邻/前序/后续节点 |
| graph.getConnectedEdges(node, { incoming: true, outgoing: false}) | 获取节点所连接的边,incoming是输入边,outgoing是输出边 |
| node.removePort/Edge(Id) | 删除连接桩/边 |
| node.removePorts/Edges() | 删除所有连接桩/边 |
| node.portProp(portId, 'attrs/circle/stroke', color) | 更新连接桩 |
| cell.prop('size', { width: 120, height: 50 }) | 修改元素的配置,这里是修改节点size |
| cell.prop(path) | 获取元素的配置,没有path就是获取所有的配置 |
| cell.attr('rect/fill', '#ccc') | 修改元素的属性,这里是修改节点填充色,等价于 cell.prop('attrs/rect/fill', '#ccc') |
| graph.to/fromJSON() | 导出/导入数据 |
依赖keybord的方法
| 方法名 | 说明 |
|---|---|
| graph.bindKey(key,callback) | 添加快捷键 |
| graph.unbindKey(key) | 解绑快捷键 |
| graph.clearKeys() | 解绑所有快捷键 |
依赖history的方法
| 方法名 | 说明 |
|---|---|
| graph.toggleHistory(boolean) | 启用/禁用history功能 |
| graph.canUndo/Redo() | 获取是否可以撤销/恢复 |
| graph.undo/redo() | 撤销/恢复 |
鼠标事件
需要注意的是,这里的 mousemove 事件和通常的鼠标移动事件有所区别,它需要在鼠标按下后移动鼠标才能触发。
除了 mouseenter 和 mouseleave 外,事件回调函数的参数都包含鼠标相对于画布的位置 x、y 和鼠标事件对象 e 等参数。
| 事件 | cell 节点/node 节点/port 连接桩/edge 边/边blank 画布空白区域 |
|---|---|
| 单击 | cell/node/node:port/edge/blank:click |
| 双击 | cell/node/node:port/edge/blank:dblclick |
| 右键 | cell/node/node:port/edge/blank:contextmenu |
| 鼠标按下 | cell/node/node:port/edge/blank:mousedown |
| 移动鼠标 | cell/node/node:port/edge/blank:mousemove |
| 鼠标抬起 | cell/node/node:port/edge/blank:mouseup |
| 鼠标滚轮 | cell/node/-/edge/blank:mousewheel |
| 鼠标进入 | cell/node/node:port/edge/graph:mouseenter |
| 鼠标离开 | cell/node/node:port/edge/graph:mouseleave |
javascript
graph.on('cell:click', ({ e, x, y, cell, view }) => {})
graph.on('node:click', ({ e, x, y, node, view }) => {})
graph.on('edge:click', ({ e, x, y, edge, view }) => {})
graph.on('blank:click', ({ e, x, y }) => {})
graph.on('cell:mouseenter', ({ e, cell, view }) => {})
graph.on('node:mouseenter', ({ e, node, view }) => {})
graph.on('edge:mouseenter', ({ e, edge, view }) => {})
graph.on('graph:mouseenter', ({ e }) => {})
插件
Keyboard&History&Clipboard&Selection
javascript
//用于快捷键
import { Keyboard } from '@antv/x6-plugin-keyboard'
//启用历史操作
import { History } from '@antv/x6-plugin-history'
//启用粘贴板
import { Clipboard } from '@antv/x6-plugin-clipboard'
//启用框选器
import { Selection } from '@antv/x6-plugin-selection'
import { Graph } from '@antv/x6'

new Graph(config)
  .use(new Selection())
  .use(new Keyboard())
  .use(new Clipboard())
  .use(new History())

// 快捷键与事件
//#region 复制粘贴 需要Clipboard插件
graph.bindKey(['meta+c', 'ctrl+c'], () => {
  const cells = graph.getSelectedCells()
  if (cells.length)graph.copy(cells)
  return false
})
graph.bindKey(['meta+x', 'ctrl+x'], () => {
  const cells = graph.getSelectedCells()
  if (cells.length) graph.cut(cells)
  return false
})
graph.bindKey(['meta+v', 'ctrl+v'], () => {
  if (!graph.isClipboardEmpty()) {
    const cells = graph.paste({ offset: 32 })
    graph.cleanSelection() //清除选中
    graph.select(cells)    //选中哪些元素
  }
  return false
})
//#endregin

//#region 撤销恢复  需要History插件
// undo撤销
graph.bindKey(['meta+z', 'ctrl+z'], () => {
  if (graph.canUndo())graph.undo()
  return false
})
// redo恢复
graph.bindKey(['meta+shift+z', 'ctrl+shift+z'], () => {
  if (graph.canRedo())graph.redo()
  return false
})
//#endregion


// 全选 需要Selection插件
graph.bindKey(['meta+a', 'ctrl+a'], () => {
  const nodes = graph.getNodes()
  if (nodes)graph.select(nodes)
})

// 删除
graph.bindKey('backspace', () => {
  const cells = graph.getSelectedCells()
  if (cells.length)graph.removeCells(cells)
})

// zoom
graph.bindKey(['ctrl+1', 'meta+1'], () => {
  const zoom = graph.zoom()
  if (zoom < 1.5)graph.zoom(0.1)
})
graph.bindKey(['ctrl+2', 'meta+2'], () => {
  const zoom = graph.zoom()
  if (zoom > 0.5)graph.zoom(-0.1)
})
Transform&Snapline&MiniMap&Export
javascript
//可用于改变节点大小,旋转节点等
import { Transform } from '@antv/x6-plugin-transform'
//对齐线
import { Snapline } from '@antv/x6-plugin-snapline'
//缩略图
import { MiniMap } from '@antv/x6-plugin-minimap'
//导出画布
import { Export } from '@antv/x6-plugin-export'
import { Graph } from '@antv/x6'
const graph = new Graph({
  background: {
    color: '#F2F7FA',
  },
})
graph
  .use(
    new MiniMap({
      container: document.getElementById('minimap'),
    }),
  )
  .use(new Export())
  .use(new Snapline())
  .use(
    new Transform({
      resizing: true,
      rotating: true,
    }),
  )
Stencil
javascript
//用于启动那种拖拽添加节点的菜单
import { Stencil } from '@antv/x6-plugin-stencil'


// #region 初始化 stencil
const stencil = new Stencil({
  title: '流程图',
  target: graph,
  stencilGraphWidth: 200,
  stencilGraphHeight: 180,
  collapsable: true,
  groups: [{
      title: '基础流程图',
      name: 'group1'
  }]
})
document.getElementById('stencil')!.appendChild(stencil.container)
// #endregion

//注册一堆节点,假设是r1,...r6
//加载节点到group1分组
stencil.load([r1, r2, r3, r4, r5, r6], 'group1')
节点
注册节点
javascript
graph.addNode(elementConfig)自定义节点
javascript
import React from 'react'
import { Graph } from '@antv/x6'
//import { register } from '@antv/x6-vue-shape';
import { register } from '@antv/x6-react-shape'

//react组件
const MyComponent = ({ node }) => {
  const color = node.prop('color')
  return (<div style={{ background: color}} />)
}

//vue组件
const myVueComponent={
    template:'<div>测试</div>',
    inject:['getNode'] //通过getNode方法获取节点实例,再去获取节点的信息
    mounted(){
        const node = this.getNode();
        //监听节点的data改变
        node.on('change:data', ({ current }) => {
          this.data = current;
        });
    },
    created() {
      this.data = this.getNode().getData();
    }
}}

//注册一个节点类型
register({
  shape: 'custom-node',
  width: 120,height: 50,
  effect: ['color'],
  component: MyComponent,
})
const graph = new Graph({ container: document.getElementById('container')})
//使用该自定义类型添加节点
const source = graph.addNode({
  x: 120, y: 50,
  shape: 'custom-node',
})
连接桩
默认/自定义/自定义复用
javascript
//1. 默认样式 连接桩默认为circle,这里仅展示⚪的连接桩
const defaultPort={ id: 'port1' }

//2. 自定义连接桩样式
const portConfig={
  id: 'port2', //连接桩id
  //如果不想用⚪的,需要markup指定用哪些元素绘制连接桩,markup具体解释看节点
  markup: markupConfig,
  attrs: attrsConfig
}
//将具有相同行为和外观的连接桩归为同一组,并通过 group 选项来设置分组
//3. 使用group将自定义样式分组,方便复用
const groupPortConfig={
    groups: {group1: portConfig},
    items: [
      { id: 'port1', group: 'group1' },
      { id: 'port2', group: 'group1' },
    ]
}
const rect = graph.addNode({
  ...,
  //ports: [defaultPort,portConfig],
  ports: groupPortConfig,
})
//元素.addProt(config)/removePort(portId/port)
rect.addPort(portConfig)
悬浮显示/移开隐藏
javascript
register({
  shape: 'custom-node',
  width: 25,
  height: 25,
  effect: ['color'],
  component: node,
  ports: {
    groups: {
      top: {
        position: 'top',
        attrs: {
          circle: {
            r: 4,
            magnet: true,
            style: {
              visibility: 'hidden'
            }
          }
        }
      },
    },
    items: [
      { id: 'port1', group: 'top' },
    ]
  }
});

graph.on('node:mouseenter', ({ cell }) => {
  cell.getPorts().forEach(port => {
    cell.setPortProp(port.id, 'attrs/circle/style/visibility', 'visable');
  });
});
graph.on('node:mouseleave', ({ cell }) => {
  cell.getPorts().forEach(port => {
    cell.setPortProp(port.id, 'attrs/circle/style/visibility', 'hidden');
  });
});
边(连接线)
路由(router):https://x6.antv.antgroup.com/api/registry/router
连接器(connector):https://x6.antv.antgroup.com/api/registry/connector#jumpover
边工具:https://x6.antv.antgroup.com/api/registry/edge-tool
高亮器:https://x6.antv.antgroup.com/api/registry/highlighter
注册边
javascript
graph.addEdge({
//source为边的起点,target为终点
source: { x: 40, y: 150 },
target: {
cell: rect, //cell对应元素,这里是连接到矩形
port: 'port2', // 连接桩 ID,每个元素一圈的小点,为连接桩
},
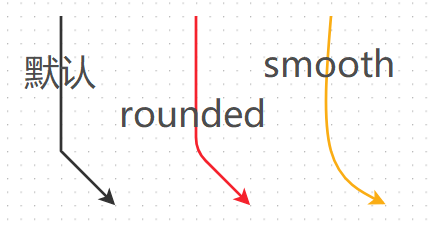
//连接器类型,定义边如何连接起始点、目标点和中间顶点
//rounded 圆角
//smooth 用于 单条的平滑曲线
connector:{name:'rounded'},
//定义一些固定的转折点,不受router影响
vertices: [{ x: 240, y: 140 }],
//路由,自动计算边的转折点, manhattan 智能路由,会避开node
router :{name: 'manhattan'},
//边的连接器类型
attrs: attrConfig,
})布局
dagre层次布局
javascript
import { DagreLayout } from '@antv/layout'
const dagreLayout = new DagreLayout({
  type: 'dagre',
  rankdir: 'LR',
  align: 'UR',
  ranksepFunc:(e)=> 35, //层次间距
  nodesepFunc:(e)=> 15, //节点间距
})
const model = dagreLayout.layout(data)
graph.fromJSON(model)